Visualization of reforestation planning
Enhancing implementation of reforestation efforts and treatment efficiency through clear marking and mapping

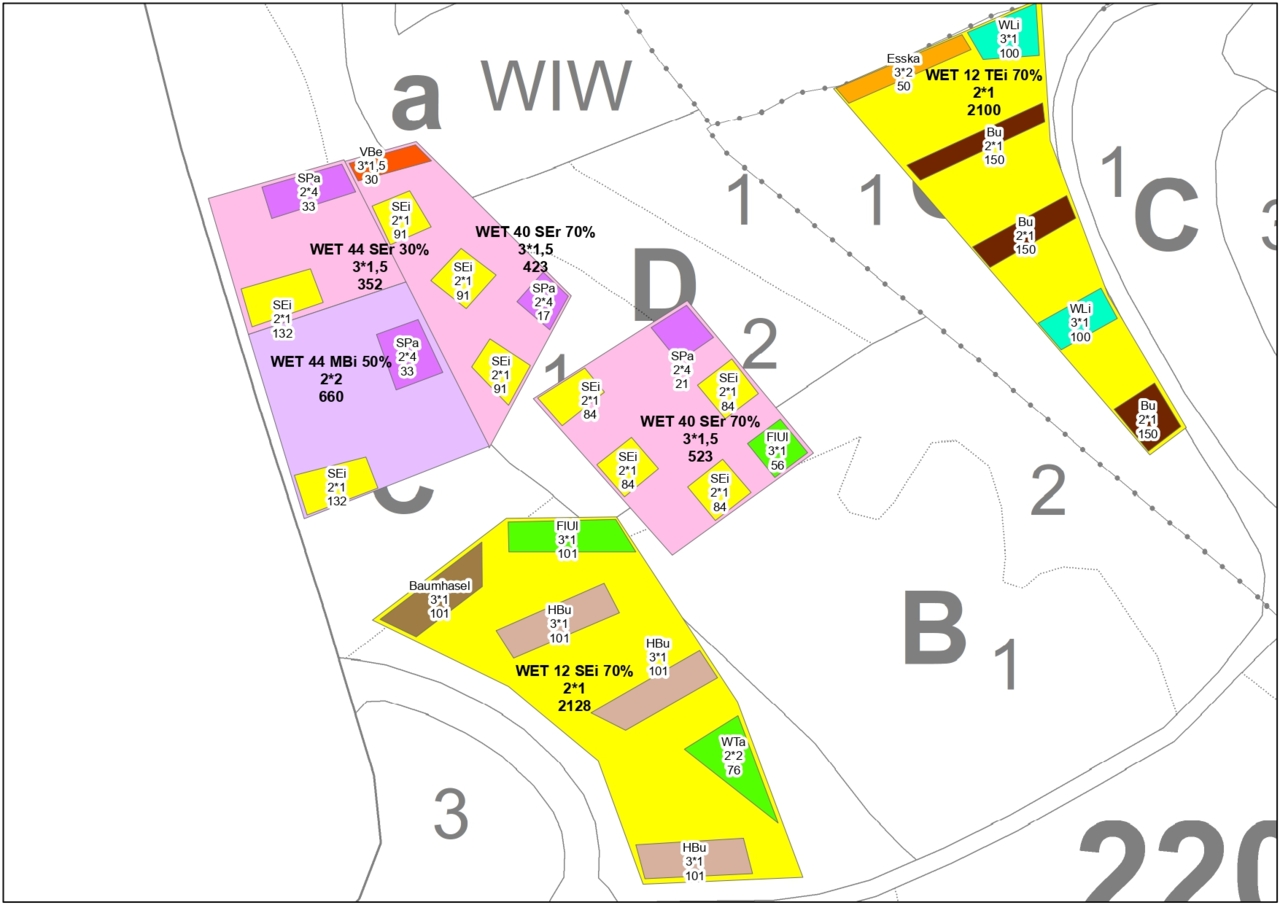
Restoration plan of SUPERB demo sites by F. Dönges from 2022. The planting groups are mapped and visualized with information on planting patterns and plant numbers per planting group.
Planners responsible for the design of a reforestation plan often rely on contractors or other personnel for the implementation of the reforestation planning. Effective communication is therefore important to ensure that the reforestation objectives, planting patterns, and maintenance needs are understood and followed during the implementation. Visualizing planting groups both on-site and in map materials aids this process by providing a clear reference for people in the field and ensuring alginment between design and implementation.
Context:
Reforestation plans are usually executed by contractors or fiel personnel, rather than the planners. Therefore, the plan needs to be communicated to and understood by the people implementing the planning on-site. Clear communication of the reforestation plan is hereby essential to ensure a proper implementation. Visualizing planting groups helps to translate the planning onto the site, ensuring that species are being planted in the locations with the most suitable site conditions considered in the planning, thus supporting plant growth and resilience. From a socioeconomic perspective, proper visualization helps minimize errors, improves planting efficiency, and may reduce costs by increasing planting success, shortening the time needed to communicate the reforestation plan, and facilitating the supervision of its implementation.
Problem Description:
Contractors often work with personnel from various linguistic backgrounds, who may lack familiarity with the site or sufficient taxonomic knowledge. Even field personnel may still be unfamiliar with specific site conditions or lack expertise in species identification. This increases the risk of miscommunication, potentially resulting in species being planted in unsuitable locations or wrong patterns, which can reduce growth and survival rates. Additionally, without clear guidance, planting groups might not be properly identified during site treatments, leading to accidental damage or incorrect treatment. Visualization of planting groups, both on-site and through maps, can help prevent these issues by ensuring that planting areas are accurately identified and species-specific care is applied during treatment interventions.
Implementation Steps:
1. Calculation of planting area: Identify a) the desired site-adapted tree species and b) their intended area shares on the reforestation site. Based on the selected planting pattern for each tree species the corresponding planting area and required number of plants per group can then be calculated.
2. Identification of suitable locations for planting groups within the reforestation area based on local site conditions.
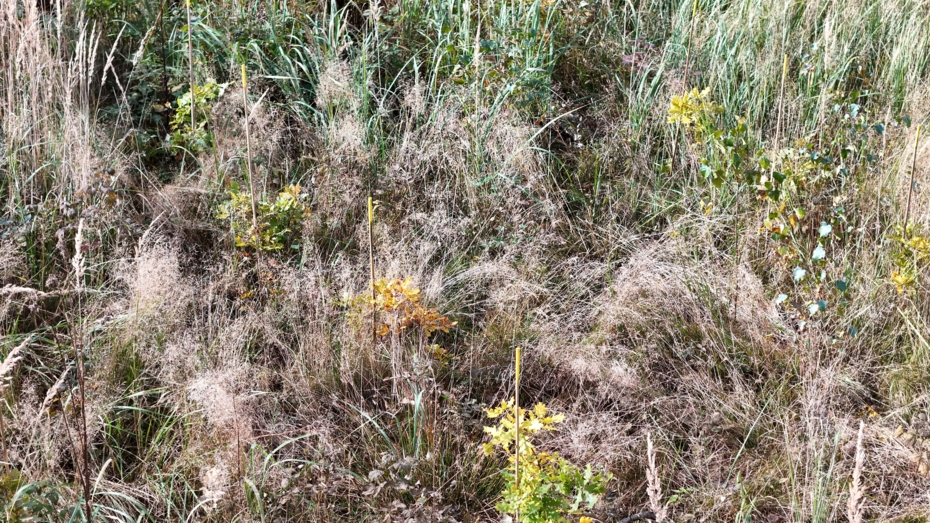
3. Mark planting groups on-site using colored sticks (ideally, different colors for per species). Different approaches can be used here depending on resource capacity and preferences. Either a) marking of corners of planting groups or b) marking of midpoint of a planting groups.
4. Mapping of stick locations using GPS or ideally GNSS.
5. Visualization of planting groups using a GIS software: Planting groups are visualized within the reforestation area as polygon- (if corners were recorded) or point-features (if the midpoint was recorded).
6. After planting, it is advised to a) map the true extent of the planting groups, especially if initially only the midpoint was marked, and b) mark the planted rows to ease subsequent treatments of the site. Depending on resource availability and tree species this can be either done by marking each plant or every X plants. The marking helps to find planting rows in competing vegetation that will grow on the reforestation site. Furthermore, the sticks help the monitoring of seedling losses and additional planting needs.
Knowledge Types:
The practice is facilitated by local practical knowledge.
Replicability:
YES, the practice has been tested and replicated in multiple contexts and scales and therefore, can be easily transferred and/or adapted to other initiatives with similar goalsPlanting groups were marked in almost all of the 29 SUPERB demo sites in NRW to aid communication with contractors or personnel implementing the reforestation planning. It is an established practice for many foresters in the region and can easily be implemented in other contexts due to the simplicity and relatively low-tech nature of the practice.
Key Success Factors:
Simmple and low-tech approach: One only needs sticks such as bamboo sticks, different colors of marking spray, a GPS or GNSS device, and a GIS software to digitalize the planting groups in a map.
Enhanced efficiency and cost saving: Visualization helps to reduce mistakes which minimizes the need for subsequent improvements.
Eased monitoring and evaluation of implementation: Visualization of planting groups and rows on-site provides for easier monitoring and evaluation of planting success. This enables a more adaptive management of the reforestation efforts and helps in tracking and reporting project progress.
Common Constraints:
Difficult terrain: In areas with steep slopes or dense competing vegetation effectively implementing and maintaining clear visual markers for planting groups can be challenging. Additionally, on-site markers may not be readily visible due to the surrounding conditions. Here the proper mapping of planting groups becomes important to orientate on the site.
Lacking satellite coverage: In areas lacking or weak GPS or GNSS signal, mapping for digitalization purposes becomes impossible or very inaccurate.
Weather: Weather conditions degrades the visibility of color markers on site over time. The color marking might thus have to be reapplied periodically to maintain the visualization of planting groups.
Lessons Learnt:
- Planting groups should be checked and if needed remapped after the planting for the digitalization of the true extent of the planting groups.
- Plantings or planting rows should be marked shortly after planting, while the plants and rows are still visible and before competing vegetation hinders movement and locating of plantings on the site.
- The marking of plantings can be adjusted based on growth patterns of planted tree species. Slower growing tree species that remain less visible amidst competing vegetation should be marked more intensively than faster-growing species.
Positive Impacts:
- Increased tree species diversity
Additional positive impacts are:
- Eased communication of restoration planning
- Reduced seedling losses through treatment
- Improved monitoring of planting success
Visualizing the reforestation plan enables an efficient implementation thereby enhancing reforestation success and enabling the growth of site-adapted mixed-species forest stands. Additionally, the practice possibly reduces reforestation costs due to the minimization of errors and damages during planting and treatment interventions as well as the shortening of time needed to communicate the reforestation plan and facilitate the supervision of its implementation.
Proper visualization on-site and through maps was a consistent recommendation provided by local foresters who implemented the SUPERB demo areas in NRW.
Media
- Active Restoration
- Implementation
- Monitoring & Projecting
- Planners & Implementers
- Afforestation, reforestation
- Atlantic
- Continental
- Germany
- Unknown


